How To Create A Custom Instagram Report for Your Clients


Creating a custom Instagram report helps clients see their progress with calm clarity. When data becomes simple, clients understand what works and what needs improvement. This brings direction and steadiness to their planning. A clear report helps remove stress and builds trust with every update.
A strong reporting system turns confusing numbers into useful insight. When you explain data in gentle language, clients feel supported and guided. This creates a sense of partnership that helps them stay confident. Good reports deepen understanding and shape meaningful decisions for steady growth.
What an Instagram Report Is
Reports make performance easy to understand. They organize many details into one simple structure that clients can follow without confusion. This makes progress feel steady and visible. A clear report allows clients to focus on improvement rather than guessing what their audience enjoys most, especially when content follows recognizable styles such as clean girl aesthetics that show consistent audience interest.
Reports also help clients stay grounded because they show patterns over time. They create a calm sense of direction and guide future planning. A thoughtful report encourages clients to keep improving their content. This brings confidence, purpose, and a clear path toward better performance.
Understanding Your Audience
Understanding your audience helps shape content that feels natural and effective. When clients see who follows them, they can share posts that connect more deeply. Audience awareness builds trust and strengthens every message they publish. Clear audience data gives clarity and reduces uncertainty during planning sessions.
Audience insights also help clients adjust their tone and timing. They discover what people enjoy most and which topics invite more interaction.
Seeing What Content Works
Seeing what works helps clients know where to focus their effort. Patterns appear when you compare results, and these patterns show what people enjoy. When clients recognize these strengths, they can repeat them with care. This gives their content direction and improves engagement naturally over time.
Clients also feel more secure when they understand why certain posts perform well. They can use these insights to refine their ideas and create a steadier rhythm in their feed.
Tracking Growth Over Time
Tracking growth reveals changes that may feel invisible day to day. Reports bring these shifts into clear view, helping clients stay motivated. Even slow progress becomes meaningful when it is shown in calm, organized detail. A similar way of understanding progress appears in explanations of growth rate, where gradual change is measured over time to reveal direction.
Growth tracking also shows which actions support real improvement. When clients see these connections, they feel empowered to make stronger decisions. This understanding offers steady direction that reduces confusion.
{{blog-cta-section}}
Metrics to Include
A strong report needs metrics that explain performance clearly. These numbers help clients understand how their content behaves and how their audience responds. When you choose the right measurements, you give clients calm clarity, which supports better decisions and consistent improvement over time.
Metrics also help clients see patterns that shape their progress. Clear data shows which actions support growth and which ones need adjustment.
Audience Data
Audience data shows who interacts with the content and how often they return. This information brings context and meaning to every number in the report. When clients understand their followers, they make smarter choices and keep their message aligned with real interests.
This section should always feel simple and calm. It should help clients see their audience as real people rather than unknown numbers. When they understand who they reach, they shape content that feels natural.
Follower Growth
Follower growth shows how the account expands over time. This is where you naturally mention real Instagram followers, because steady organic growth reflects genuine interest. When clients see these numbers rise, they feel encouraged and supported. Growth patterns help them stay focused and grounded in their progress.
These numbers also show which actions create movement. When clients compare growth to their posting habits, they understand cause and effect. This makes planning simpler and more intentional.
Demographics
Demographics help clients understand who follows them by showing age, location, and gender in clear groups. These details guide content choices with a calm structure.
Demographic insight also supports long-term planning. When clients understand follower backgrounds, they adjust tone and message with greater accuracy. This makes the account more inviting and effective.
Active Times
Active times show when followers are online. Instagram bots are not relevant here. This information helps clients post at natural moments of peak attention. When timing matches audience behavior, posts enjoy better reach and stronger interaction. This supports a steadier rhythm and builds consistent engagement without additional effort.
These insights also reduce guesswork. Clients learn when their audience prefers to view content, and they use this knowledge to plan calmly. When posting aligns with audience habits, accounts experience improved performance.
Content Results
Content results show how each post performs. These numbers reflect what people enjoy and which formats draw attention. When clients see these results clearly, they understand how their choices influence outcomes.
This section also supports a stronger strategy. When clients compare different kinds of content, they recognize important patterns. These insights allow them to refine their approach. They can create posts that feel natural to their audience and stay aligned with real engagement signals.
Reach and Impressions
Reach shows how many unique people saw a post, while impressions show how many total views occurred. These two numbers offer a calm view of visibility. They help clients understand whether their message spreads widely or remains closer to their existing audience.
These insights work together to show how effective content can become. When reach grows, visibility expands naturally.
Engagement
Engagement measures like likes, comments, shares, and saves. It shows how deeply people connect with the content. This is the right place to use Instagram marketing, because engagement reflects how well the message fits the audience and strengthens the overall strategy in simple, practical ways.
When engagement rises, clients feel encouraged because people interact with care. Engagement also reveals whether content inspires emotion or thought. These signals help shape long-term planning.
Best Posts and Reels
Best Instagram posts show which content styles perform strongly. When clients see these highlights, they understand what appeals to their audience. This gives them direction and helps them repeat successful elements. Strong content patterns help guide creative choices for future planning and further growth.
Reels offer similar insight. When certain reels perform above average, clients learn which movements, ideas, or sounds interest people most. This understanding encourages better storytelling.
Story Insights
Story insights show how viewers respond through taps, exits, replies, and completion rates. These details help clients understand how well their stories hold attention. When stories perform well, they become a simple way to build daily awareness with calm, intentional updates.
This section also shows how people move through content. When clients learn what keeps viewers watching, they create stronger stories over time.
{{blog-cta-section}}
Profile Actions
Profile actions show how people behave after viewing content. These metrics reflect deeper interest and movement toward further exploration. When clients understand these actions, they see how their content invites people into their world.
These behaviors show whether the account inspires curiosity. When profile actions rise, clients know viewers want more connection.
Link Clicks
Link clicks reveal how many people wanted more information or visited a website. This metric shows whether content inspires meaningful action. When clients see rising clicks, they understand that their calls to action feel clear and helpful to their audience.
Link performance also helps refine communication. When clicks fall, clients adjust messaging to create stronger interest. When clicks rise, they repeat effective patterns. This simple cycle helps shape better conversions and creates healthier habits for long-term growth and connection.
Posting Activity
Posting activity shows how often content is shared. This information helps clients understand how consistency influences audience behavior. When they compare activity with results, they learn the value of steady posting habits and adjust their schedule to match natural patterns and long-term goals. A similar view of consistent planning appears in simple explanations of posting schedule, where rhythm and balance support sustainable performance.
This metric supports calm reflection. Clients discover whether more or fewer posts bring stronger results. It also highlights the effect of timing and variety. Clear activity charting gives direction and helps clients refine their rhythm with confidence and gentle improvement over time.
Hashtag Performance
Hashtag performance shows which tags support visibility. When clients understand which tags attract attention, they can refine their strategy. This metric helps expand reach without pressure. When hashtags work well, they support calm discovery and help attract a natural audience.
Good hashtag insight reduces confusion. When clients see which tags serve them best, they stay focused on what works. This brings clarity to content planning.
Competitor Checks
Competitor checks help clients understand their position in a larger landscape. When they study similar accounts, they see real patterns and learn what others are doing successfully.
These checks bring clarity to performance expectations. Clients learn what is common and what stands out. Seeing how other accounts behave, especially those shaped by top Instagram influencers, helps guide a better strategy.
Trend Comparison
Trend comparisons show which topics and styles are rising. When clients understand these movements, they adjust their content with gentle intention. This helps their posts stay aligned with audience interests and keeps their message relevant within the changing environment of the platform.
Trends also teach clients how the landscape shifts. When certain ideas perform well for many accounts, clients can join those conversations thoughtfully.
Share of Voice

Share of voice shows how often people mention a brand compared to others. This metric reveals presence and recognizability. When clients see their share of voice grow, they understand that their message spreads calmly and steadily within their chosen space.
This insight encourages long-term thinking. As share of voice expands, clients know their brand becomes more familiar to their audience.
How To Build the Report
Building a report requires calm structure and thoughtful steps. Each part should guide clients through the data gently so they understand without confusion. A well-organized report feels simple even when many numbers appear.
Each step shapes the final clarity. When you follow a steady sequence, the report becomes meaningful and easy to read. This structure allows clients to see progress at a glance. A calm process helps the final report feel complete and confidently prepared.
Step 1: Set Client Goals
Setting goals is the first step in shaping a meaningful report. Clear goals help guide which metrics matter and which ones can remain background details. This brings direction and focus, helping clients understand the purpose behind every number you include.
Goals also help clients stay grounded. When expectations match the objectives chosen at the beginning, progress feels real and motivational.
Awareness
Awareness goals help clients understand how many people see their content. These goals support visibility and growth. When clients track awareness calmly, they focus on improving reach without pressure. This encourages healthy expansion and steadier planning for future content decisions.
Awareness also helps clients stay patient. Visibility rarely changes overnight, so tracking this metric teaches them to appreciate slow improvement. When they recognize small rises, they remain encouraged and committed.
Engagement
Engagement goals help clients understand how people interact with their content. These numbers reveal emotional connection and genuine interest. When engagement rises, clients feel supported by their audience. This calm reassurance helps them continue refining their style and delivering meaningful posts for a deeper connection. A similar way of understanding interaction appears in explanations of engagement metrics, where responses and actions reflect audience interest.
Engagement goals also help identify strengths. When clients know which posts spark responses, they repeat effective elements and improve weaker ones. This creates a pattern of steady improvement.
Conversions
Conversion goals measure what people do after seeing content. These actions show deeper interest and real value. When clients see rising conversions, they understand that their message resonates beyond simple engagement.
Conversions also help shape practical growth. When clients understand which strategies encourage action, they refine their approach with confidence.
{{blog-cta-section}}
Step 2: Pick a Format
Choosing the correct format helps shape the tone of the entire report. A clear structure makes information easier to read, understand, and reference later. When clients receive a clean document, they feel supported and guided. This improves trust and strengthens communication over time.
Different formats offer different advantages. Visual styles help clients who prefer pictures, while text-based structures support detailed explanations. Choose a format that matches your client's comfort and needs. This simple consideration ensures the report feels helpful, accessible, and easy to follow.
A PDF report offers a stable and professional format. It keeps your layout intact no matter where clients open it. This brings consistency and helps clients revisit past reports with ease. A PDF feels polished and encourages careful reading and thoughtful review.
PDFs also support long-term storage. Clients can file them and compare months of progress without losing clarity. This makes the report a calm reference point. A reliable format helps clients feel organized and confident when tracking their ongoing performance and development.
When mid-month changes arise, annotating charts, swapping screenshots, or reordering pages, you can tweak your PDFs online using a free, browser-based editor with simple page controls and collaborative comments, then export or share a fresh link. Quick edits keep reports accurate without rebuilding your layout.
Dashboards
Dashboards offer real-time updates. They show numbers shifting throughout the month, which helps clients stay aware of their performance. A dashboard works well for clients who prefer visual information. It creates clear summaries without overwhelming detail or disorganized presentation. A similar explanation of visual reporting appears in descriptions of analytics dashboards, where key data is grouped to support quick understanding.
Dashboards also allow simple comparisons. Clients can check progress whenever they like and adjust plans calmly. Live data encourages better decisions because results feel immediate and understandable.
Slide Style
Slide-style reports help simplify presentations. They show key points in gentle order, which allows clients to follow without confusion. Slides work well for meetings or monthly reviews. They highlight what matters most and keep information clear and calm throughout the report.
Slides also help clients focus on direction. They encourage short explanations and useful summaries. When ideas stay brief, clients absorb them with ease. This structure makes slides helpful for teams who want fast updates without heavy detail or unnecessary pressure.
Step 3: Collect Data

Collecting data begins with choosing tools that present information clearly. Each platform brings different strengths, so it helps to gather numbers from trusted sources. The process should feel simple and calm.
Data collection also builds the foundation for the entire report. When numbers stay organized, the final structure feels smooth and accurate. This brings clarity and trust. Clients feel safe when their report relies on steady information gathered through patient, thoughtful steps and consistent, careful review.
Instagram Insights
Instagram Insights offers reach, impressions, engagement, and story data in one clean place. It helps clients see what people enjoy and when they respond. This tool remains steady even as Instagram updates today continue shaping how content appears and performs for different audiences.
Insights also support focused planning. They help clients stay connected to their audience and adjust content with greater intention. When numbers feel easy to understand, planning becomes comfortable. This tool gives a gentle starting point for every report and encourages clear communication across months.
Step 4: Organize Sections
Organizing sections shapes the experience of reading the report. A calm order helps clients move from one idea to the next without feeling overwhelmed. When information sits in a gentle structure, each part builds toward understanding, and clients feel supported throughout the entire reading process.
A good organization also ensures that nothing important becomes hidden. Each section stays visible and purposeful. This helps clients absorb information with ease.
Audience Overview
An audience overview gives clients a warm introduction to their results. They see who follows them, how people engage, and what patterns shape their growth. This prepares them for deeper insights later. A gentle overview helps clients understand context without feeling pressured by large sets of numbers.
The audience overview also builds confidence. When clients see their community clearly, they connect more deeply with their goals. This section should feel reassuring and calm. It encourages clients to appreciate the people interacting with their content and prepares them for the following detailed sections.
Content Summary
A content summary presents highlights from recent posts and stories. It shows which topics received attention and which ones performed quietly. When clients view this summary, they understand their strengths clearly. This helps guide planning and encourages them to repeat successful ideas in future content.
This summary also highlights areas needing improvement. When clients see gentle reminders in calm language, they adjust with ease.
Growth Trends
Growth trends show how numbers shift over time. Clients see progress even when it moves slowly. This calm perspective helps them appreciate small improvements. When trends appear visually, they become easier to interpret, which encourages steady motivation and a healthier understanding of long-term performance patterns.
Trends also highlight patterns that shape future decisions. When clients understand how their audience responds through seasons or campaigns, they adjust with confidence. Clear trend lines offer direction and comfort.
Custom KPIs
Custom KPIs reflect specific goals chosen earlier. They make the report feel personal and thoughtful. When clients see numbers tied to their aims, they understand progress clearly. These indicators guide deeper reflection and help shape a calm, purposeful strategy that matches their long-term vision naturally. A similar way of defining success appears in explanations of key performance indicators, where focused metrics help track meaningful progress.
When clients monitor only what matters most, they avoid confusion. Focused tracking builds confidence and offers gentle direction. A strong KPI section ensures clients stay motivated and aware of how their actions support steady improvement across their chosen areas of growth.
{{blog-cta-section}}
Step 5: Add Explanations
Explanations help clients understand numbers with ease. When data becomes simple stories, clients see patterns clearly. This transforms information into guidance. Calm explanations remove stress and create trust because clients feel supported in understanding their progress and planning their next helpful steps.
Good explanations also show your expertise. When clients feel guided, they appreciate your clarity and care. Simple words make reports more valuable. When clients understand why things happened, they make better decisions. Clear explanations strengthen relationships and give the report steady meaning throughout every section.
What Worked
This section celebrates wins with gentle confidence. When clients see what they performed well, they feel encouraged. Highlighting strengths helps them appreciate their improvement. These wins show how their efforts create value. This encouragement strengthens their motivation and shapes a positive mindset for future planning decisions.
Understanding what worked also teaches clients how to repeat success. When insights appear clearly, clients use them to refine their strategy.
What Needs Fixing

This section identifies areas that deserve improvement. These points should feel soft and constructive. Clients appreciate honesty when it arrives gently. Calm refinement helps them grow without stress. Each suggestion guides healthy change and builds a clearer understanding of their audience and content performance. A similar approach to thoughtful guidance appears in explanations of feedback basics, where clear insight supports gradual improvement.
Improvement becomes easier when clients receive direction. These insights prepare them to adjust their approach thoughtfully. When weaknesses appear in simple phrases, clients stay calm and receptive. This section supports long-term learning.
Next Steps
Next steps give clients a gentle roadmap. These actions help them stay focused and confident. When directions feel simple, clients follow them easily. Clear steps reduce confusion and bring steady movement toward improvement.
Next steps also help clients feel proactive. When they understand what happens next, they remain committed. This clarity builds trust. Action items become valuable tools that guide growth.
Step 6: Add Visuals
Visuals help clients understand data quickly. Charts, lines, and tables bring clarity to complex numbers. When visuals appear calm and clean, reading becomes easier. Clients see patterns instantly.
Visuals also support deeper comprehension. A simple design guides the eye and creates structure. Clients appreciate seeing information presented clearly. This strengthens understanding and makes the report more memorable.
Charts
Charts show data movement in clear shapes. They help clients understand trends without interpreting long text or complex tables. Simple visual changes feel easier to grasp. Charts make the report feel more alive and accessible, offering a snapshot of performance that supports comfortable interpretation.
Charts also encourage comparisons across periods. They let clients see progress instantly. When numbers appear visually, clients connect with them more naturally. This builds confidence in understanding their results.
Tables
Tables present detailed information in orderly rows. They create a calm place to compare results with clarity. When numbers remain balanced in simple columns, clients feel comfortable reviewing them. Tables help maintain order, making them essential for reporting sections that require precision across multiple data points. A similar explanation of structured layouts appears in descriptions of data tables, where information is organized to support careful comparison.
Clients appreciate tables because they can revisit them whenever needed. Tables offer stability and structure. They allow clients to see patterns slowly and carefully.
Trend Lines
Trend lines show slow shifts across time. They create a simple story of growth or decline. When clients see these lines, they understand progress with ease. Trend lines help them stay patient, offering quiet reassurance that small changes still hold meaningful direction and eventual improvement.
Trend lines also support calm analysis. They reveal long-term patterns that might be difficult to notice in daily results. Clients use these lines to understand rhythm. This strengthens planning because they adjust based on real movement.
{{blog-cta-section}}
Tips for Better Reports
Helpful tips make reports easier for clients to understand. When you provide practical suggestions, clients know how to interpret their results without confusion. Calm and simple guidance encourages clearer focus. It gives clients confidence because the report feels like a friendly tool rather than a difficult technical document.
Strong tips also help clients improve their work. When direction appears in small steps, they follow it naturally. Each suggestion becomes an opportunity for thoughtful progress. This keeps clients centered and helps them continue shaping better content with renewed clarity and comfort moving forward.
Tailor to Each Client
Tailoring reports to each client makes the information feel personal. Custom insight shows that you understand their goals. This builds trust and comfort. When clients read words chosen specifically for them, they feel seen, supported, and motivated to act on the report with confidence.
A tailored approach also keeps reports relevant. Every brand has its own rhythm, and reports should reflect that. When you adjust examples, sections, and explanations, the report becomes meaningful. This makes clients feel valued and strengthens long-term collaboration built on calm communication and steady understanding.
Highlight Wins Clearly
Highlighting wins helps clients feel encouraged. Even small achievements matter because they show forward movement. When wins appear clearly in the report, clients gain confidence in their work. This builds emotional resilience and motivates them to continue creating thoughtful content throughout their ongoing growth journey.
Wins also reveal strengths clients can repeat. When you point out working strategies, they learn what brings consistent results. This guides future decisions in a calm and empowering way.
Give Simple Action Steps
Simple action steps guide clients with ease. When instructions feel light and clear, clients follow them comfortably. Each step becomes a small path toward improvement. These gentle directions help clients feel empowered because they know what to do next without confusion or stress during their planning.
Action steps also reduce frustration. Clear directions remove complicated decisions and create a steady structure. This is similar to learning how to mute someone on Instagram, where a simple feature becomes easier with guidance. Straightforward advice calms clients and helps them feel supported in shaping their content strategy.
Tools That Help
Tools make the reporting process easier. They gather information, organize it, and present it with calm structure. Using the right tools brings steady accuracy and saves time. This helps clients receive clear reports that explain progress in simple words and easy visuals rather than heavy, complicated documents.
Tools also support long-term growth. When you rely on consistent platforms, your reports remain stable each month. Clients appreciate predictable structures. Tools help shape habits that strengthen your workflow. They become a foundation for clarity, making each report feel thoughtful, clean, and organized.
Instagram Insights

Instagram Insights provides reach, impressions, engagement, and audience details in one calm space. It helps clients understand how people respond to their work. Insights offer gentle explanations without overwhelming complexity. The familiar format reduces confusion and supports clear and steady interpretation of important data every month.
Insights remain useful because they show patterns that guide planning. When clients learn how their audience behaves, they adjust choices with confidence.
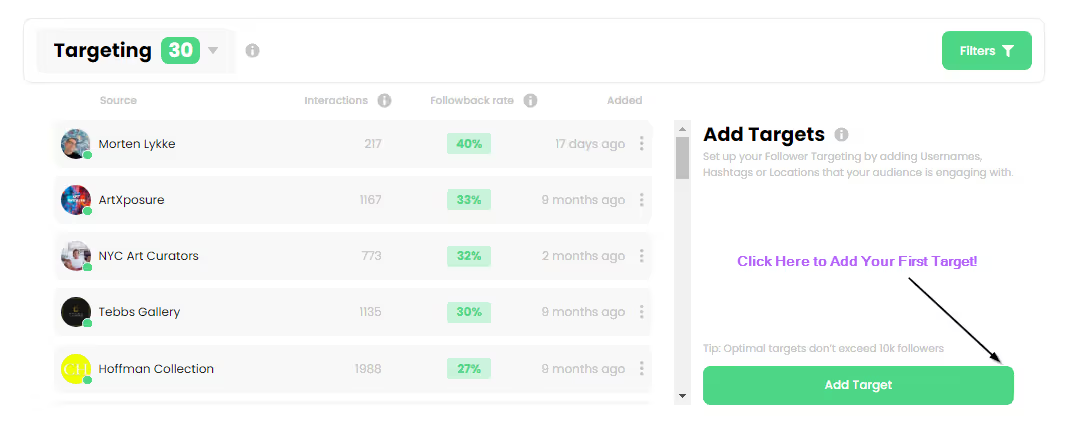
Kicksta
Kicksta helps clients attract steady and organic attention from real viewers. It also demonstrates the benefits of Instagram growth service because it brings interest from people who genuinely care. This makes performance easier to understand and supports long-term improvement through slow, thoughtful enhancement of audience quality.
Kicksta also helps clients understand which content attracts the right viewers. When their audience grows with care, clients feel encouraged. It becomes easier for them to refine their work. Kicksta supports meaningful engagement and helps shape a peaceful, long-term path toward improvement and stability.
Final Notes
Final notes help clients understand the heart of the report. They bring gentle closure and help them reflect calmly. This space reinforces their progress and reminds them that improvement comes through patience. When final notes stay simple, clients feel supported and ready for their next steps.
A strong closing message brings comfort. It helps clients leave the report with clarity instead of worry. When they understand their direction, they feel steady and encouraged. Final notes remind them that growth happens slowly and consistently, and each small movement matters greatly.